
Forex candlestick patterns explained simply: these are visual formations created by price movements on trading charts that help traders identify potential trend reversals, continuations, and market sentiment shifts. Understanding candlestick chart patterns forex traders rely on provides critical insights into when buyers or sellers control the market, enabling more informed trading decisions.
What Are Forex Candlestick Patterns? A Clear Definition
Forex candlestick patterns are visual representations of price action within specific timeframes that display the open, high, low, and close prices for a currency pair. Each individual candlestick provides a snapshot of market behavior during periods ranging from one minute to one month, depending on your chart settings.
The history of candlestick charting history traces back to 18th century Japan, where rice trader Munehisa Homma developed this methodology in the 1700s to track rice contract prices. Japanese candlestick analysis remained largely unknown in Western markets until Steve Nison introduced these techniques through his research in the 1990s, revolutionizing how traders interpret price movements.
Every candlestick consists of four core components that work together to tell a complete story about market activity. The body of the candlestick shows the opening and closing prices while wicks (also called shadows) display the high and low prices reached during that period. When the close is higher than the open, the candle typically appears green or white, indicating bullish price movement. Conversely, when the close is lower than the open, the candle appears red or black, signaling bearish activity. Understanding these fundamentals is essential for traders who want to master Forex Candlestick Patterns and improve their market analysis skills.
Candlestick patterns matter because they reveal underlying market psychology and potential trend reversals or continuations before they fully develop. By recognizing specific formations, traders gain insights into the battle between buyers and sellers, allowing them to anticipate future price movements with greater accuracy than simple line charts provide. This is why learning Forex Candlestick Patterns has become one of the most effective ways for beginner and advanced traders to identify high-probability trading opportunities in the Forex market.

How Forex Candlestick Patterns Work: Reading Market Psychology
Understanding how to read forex candlesticks begins with mastering the anatomy of a single candle. A bullish candlestick (typically colored green or white) forms when the closing price exceeds the opening price, indicating buying pressure dominated the timeframe. The opposite occurs with bearish candlesticks (red or black), where sellers pushed the price below the opening level by the close. Learning these basics is the foundation for understanding Forex Candlestick Patterns and improving technical analysis skills in the currency market.
Why Forex Candlestick Patterns Matter in Trading
The true power of Japanese candlestick analysis emerges when multiple candles combine to form recognizable patterns that signal trader sentiment and potential market direction changes. These formations occur because they represent repeating human psychology patterns—fear, greed, indecision, and conviction—that have remained constant throughout trading history. This is why experienced traders rely heavily on Forex Candlestick Patterns to identify potential reversals and trend continuation opportunities.
Step-by-Step Guide to Using Forex Candlestick Patterns
The step-by-step process for applying candlestick patterns involves four critical stages. First, identify the pattern formation as it develops on your chart, ensuring all required candles have closed to confirm the pattern. Second, examine the context by checking whether the pattern appears at a significant support or resistance level, as reversal patterns typically require 1-3 candlesticks to form and are most reliable when appearing at established technical levels. Third, confirm the signal with additional indicators such as volume increases or momentum oscillators that validate the pattern’s strength. Finally, time your entry and exit by waiting for the confirmation candle that follows the pattern completion. Following this structured approach helps traders use Forex Candlestick Patterns more effectively in live market conditions.
A real-world example demonstrates this process clearly. Consider a bullish engulfing pattern on the EUR/USD currency pair during a downtrend. The first candle shows a small bearish body, confirming sellers remain in control. Examples like this show why Forex Candlestick Patterns remain one of the most trusted tools in modern forex trading strategies.
Successful traders understand that mastering Forex Candlestick Patterns is not about memorizing random candle shapes—it is about interpreting market psychology and combining candlestick signals with broader technical analysis. With consistent practice, traders can use Forex Candlestick Patterns to improve trade timing, reduce emotional decisions, and build more confident trading strategies over time.
Chart platforms like MetaTrader display these patterns clearly across all timeframes, allowing traders to identify formations whether they’re day trading on five-minute charts or swing trading on daily charts. The principles of technical analysis fundamentals remain consistent regardless of the specific currency pair or timeframe selected.

Major Types of Candlestick Patterns Every Forex Trader Should Know
Mastering the most effective candlestick chart patterns forex traders use requires understanding three main categories: single candlestick patterns, reversal patterns, and continuation patterns. Each category serves a distinct purpose in identifying trading opportunities.
Single Candlestick Patterns
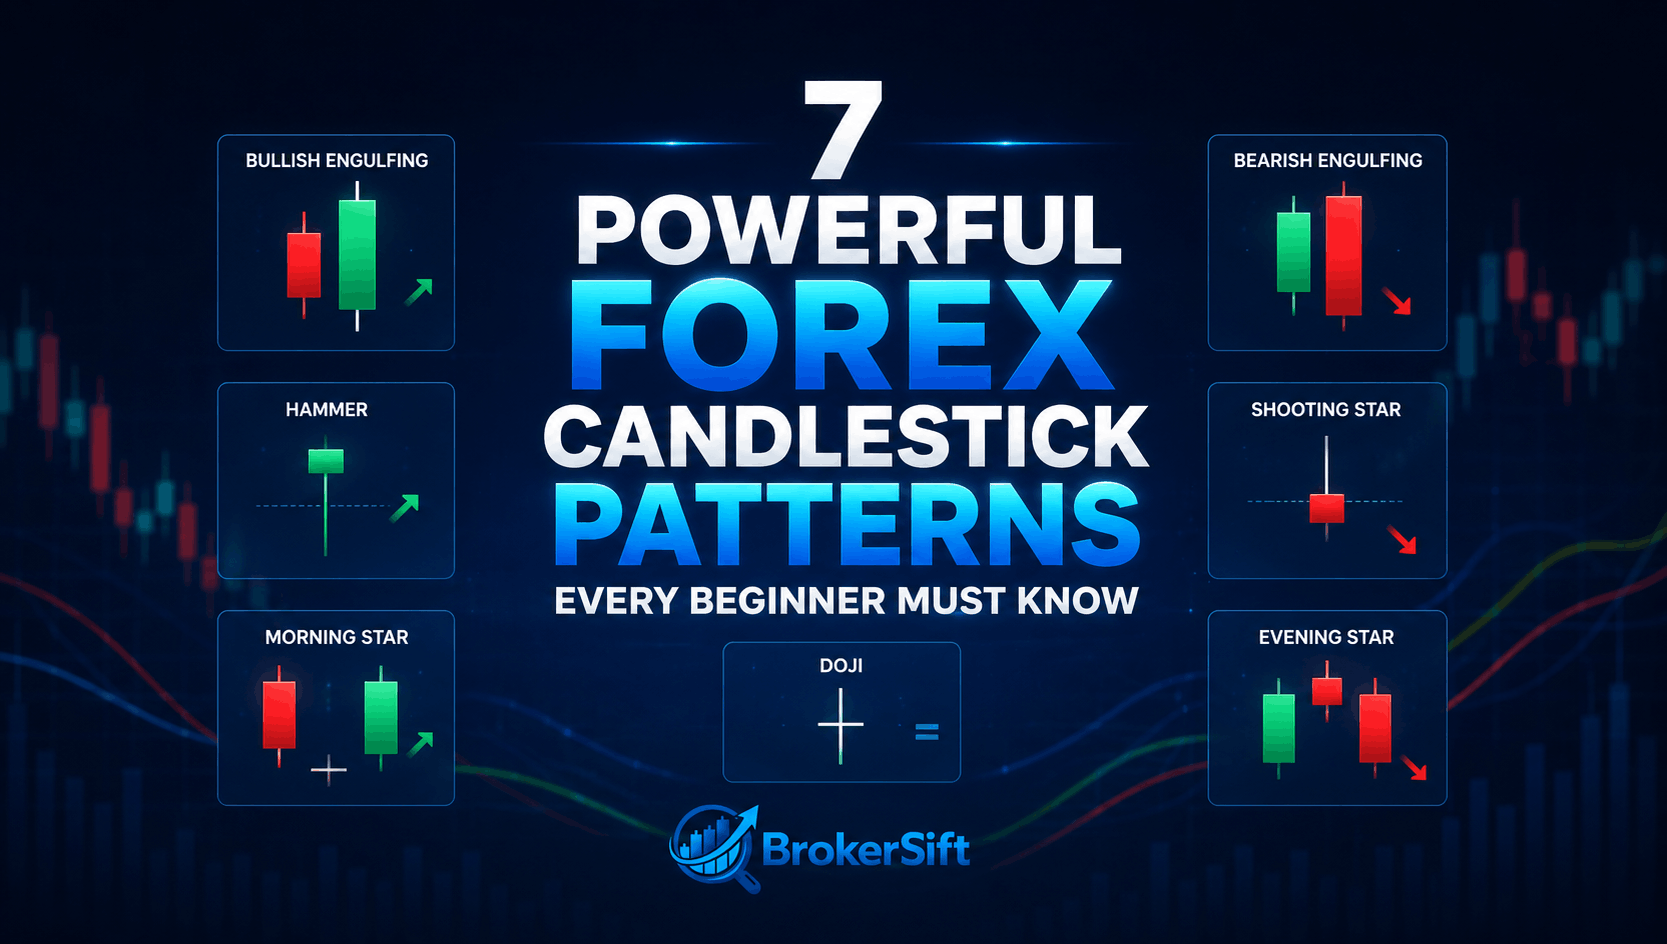
Single candlestick patterns provide immediate insights into market indecision or potential reversals. The Doji forms when opening and closing prices are virtually identical, creating a cross or plus sign shape that signals market indecision and potential trend exhaustion. Traders studying Forex Candlestick Patterns often use the Doji to identify possible turning points in trending markets.
The Hammer appears at the bottom of downtrends with a small body, little to no upper wick, and a long lower wick at least twice the body length, indicating sellers pushed prices lower but buyers regained control by the close. The Shooting Star mirrors the Hammer but appears at the top of uptrends, featuring a small lower body and long upper wick that signals buyers lost control to sellers. These formations are among the most widely recognized Forex Candlestick Patterns because they help traders spot early reversal signals and improve trade timing.
Bullish Candlestick Patterns (Reversal)
Bullish candlestick patterns signal potential upward reversals when appearing after downtrends at support levels. The Bullish Engulfing pattern consists of a small bearish candle followed by a larger bullish candle that completely engulfs the previous candle’s body, demonstrating a decisive shift in market control from sellers to buyers. Among the most effective Forex Candlestick Patterns, the Bullish Engulfing pattern is widely used by traders to identify strong reversal opportunities in the forex market.
The Morning Star is a three-candle formation beginning with a long bearish candle, followed by a small-bodied candle (indicating indecision), and completing with a strong bullish candle that closes well into the first candle’s body. The Piercing Pattern features a bearish candle followed by a bullish candle that opens below the previous low but closes above the midpoint of the bearish candle’s body, suggesting buyers are challenging seller dominance. These bullish setups are considered highly reliable Forex Candlestick Patterns because they reveal changing market sentiment and potential momentum shifts before a new uptrend begins.
Bearish Candlestick Patterns (Reversal)
Bearish reversal patterns appear at resistance levels following uptrends, warning traders of potential downward moves. The Bearish Engulfing pattern reverses the bullish version—a small bullish candle followed by a larger bearish candle that engulfs the entire previous body, signaling sellers have seized control. Many professional traders rely on these Forex Candlestick Patterns to detect weakening bullish momentum and prepare for possible market reversals.
The Evening Star mirrors the Morning Star but signals bearish reversals through a long bullish candle, small indecision candle, and completing bearish candle. The Dark Cloud Cover occurs when a bearish candle opens above the previous bullish candle’s high but closes below its midpoint, indicating sellers are gaining strength. These bearish formations are among the most powerful Forex Candlestick Patterns for identifying trend exhaustion and spotting potential selling opportunities in volatile forex markets.
Continuation Patterns
Continuation patterns confirm existing trends rather than reversing them. The Rising Three Methods appears during uptrends as a long bullish candle followed by three smaller bearish candles that remain within the first candle’s range, completing with another strong bullish candle that confirms upward momentum continues. The Falling Three Methods provides the bearish equivalent, validating downtrend continuation through a similar structure with inverted colors.
| Pattern Type | Number of Candles | Signal | Best Used At | Reliability |
|---|---|---|---|---|
| Doji | 1 | Indecision/Reversal | Trend extremes | Medium (requires confirmation) |
| Hammer | 1 | Bullish Reversal | Support levels | Medium-High |
| Bullish Engulfing | 2 | Bullish Reversal | Downtrend bottoms | High |
| Bearish Engulfing | 2 | Bearish Reversal | Uptrend tops | High |
| Morning Star | 3 | Bullish Reversal | Major support zones | High |
| Evening Star | 3 | Bearish Reversal | Major resistance zones | High |
| Rising Three Methods | 5 | Bullish Continuation | Mid-uptrend | Medium |
Practical application requires combining these patterns with support and resistance levels and overall trend context. A bullish engulfing pattern appearing at a historical support level during a broader uptrend carries significantly more weight than the same pattern appearing mid-trend without technical confluence. Similarly, volume analysis enhances pattern reliability—reversal patterns accompanied by increased trading volume demonstrate stronger conviction and higher probability of success.
Best Practices, Common Mistakes, and Risk Management
Even experienced traders fall into predictable traps when applying candlestick patterns to forex markets. The most critical mistake involves trading patterns in isolation without confirming indicators or market context. A perfect hammer formation means little if it appears mid-trend without support confluence or if broader market sentiment contradicts the pattern’s signal. Studies show Forex Candlestick Patterns work best when combined with other technical indicators rather than used as standalone trading signals.
Common Mistakes Traders Make with Forex Candlestick Patterns
Timeframe selection significantly impacts pattern reliability across different time horizons. Patterns appearing on daily or four-hour charts generally provide more reliable signals than those on one-minute or five-minute charts, which often contain excessive market noise and false signals. Short-term traders must accept lower reliability and adjust position sizing accordingly, while swing traders benefit from the clearer signals that longer timeframes provide. A bullish engulfing pattern on a daily chart of EUR/USD carries considerably more weight than the same pattern on a five-minute chart. Understanding how different timeframes affect Forex Candlestick Patterns can help traders avoid false entries and improve overall trading accuracy.
Another common mistake is ignoring risk management while trading Forex Candlestick Patterns. Even the strongest candlestick setups can fail due to unexpected news events, market volatility, or changing economic conditions. Successful traders always combine candlestick analysis with stop-loss placement, proper position sizing, and confirmation from broader market trends to reduce unnecessary risk and protect trading capital.
Read More: Best broker for forex and crypto
Confirmation Techniques
Successful pattern trading demands patience for pattern completion and signal confirmation. Never enter trades based on incomplete patterns—wait until the decisive candle closes to ensure the formation truly matches the expected structure. Following pattern completion, seek confirmation through the next candle’s price action or supporting indicators. Volume analysis provides powerful confirmation—reversal patterns accompanied by volume spikes demonstrate genuine market conviction rather than temporary fluctuations. These confirmation techniques help traders use Forex Candlestick Patterns more accurately and avoid entering low-probability trades.
Momentum indicators like the Relative Strength Index (RSI) or Moving Average Convergence Divergence (MACD) can validate candlestick signals. When a bullish reversal pattern appears alongside oversold RSI readings or bullish MACD crossovers, the combined signals substantially increase trade probability. Similarly, identifying patterns at established support and resistance levels adds technical confluence that strengthens the setup. Combining technical indicators with Forex Candlestick Patterns allows traders to build stronger trading strategies and improve decision-making in fast-moving forex markets.

Risk Management Guidelines
Proper risk management transforms candlestick pattern recognition from gambling into systematic trading. Set stop-losses based on pattern structure rather than arbitrary percentages. For reversal patterns, place stops just beyond the pattern’s extreme—below the low for bullish setups, above the high for bearish setups. This logical placement ensures you exit if the pattern fails rather than holding losing positions hoping for recovery. Successful traders often combine these principles with Forex Candlestick Patterns to create more disciplined and consistent trading strategies.
Position sizing must account for stop-loss distance and account risk tolerance. Never risk more than 1-2% of your trading capital on any single pattern-based trade, regardless of how confident the setup appears. Calculate position size by dividing your maximum risk amount by the stop-loss distance in pips, ensuring consistent risk management across all trades. Applying strong risk management techniques alongside Forex Candlestick Patterns can significantly reduce emotional trading decisions and improve long-term profitability in forex markets.
Actionable Learning Strategies
Developing pattern recognition skills requires deliberate practice before risking capital. Spend time identifying patterns on historical charts across various currency pairs and timeframes, noting which formations led to successful moves and which failed. This retrospective analysis builds pattern recognition intuition and reveals market conditions where specific patterns perform best. Traders who consistently study Forex Candlestick Patterns can improve their ability to recognize high-probability setups in real market conditions.
Maintain a detailed trading journal documenting every pattern-based trade including the setup, entry reasoning, outcome, and lessons learned. Over time, this journal reveals your personal strengths and weaknesses with different patterns, allowing you to focus on high-probability setups that match your trading style. Many traders discover they excel with certain patterns while struggling with others—this self-awareness dramatically improves long-term profitability.
Start with paper trading or demo accounts when first applying candlestick patterns, allowing you to gain experience without financial risk. Once you demonstrate consistent pattern recognition and profitable decision-making in simulated environments, gradually transition to live trading with small position sizes. This measured approach builds confidence and competence simultaneously. Practicing Forex Candlestick Patterns in demo trading environments helps traders refine their strategies and reduce emotional decision-making before entering live markets.
What is the most reliable candlestick pattern in forex trading?
The bullish and bearish engulfing patterns rank among the most reliable candlestick formations when appearing at significant support or resistance levels with volume confirmation. These two-candle patterns clearly demonstrate a shift in market control and work effectively across all major currency pairs including EUR/USD, GBP/USD, and USD/JPY. However, no pattern guarantees success—reliability increases substantially when combined with trend context, technical levels, and confirming indicators rather than trading patterns in isolation.
How many candlestick patterns should a beginner learn first?
Beginners should focus on mastering five to seven core patterns before expanding their knowledge: the Doji, Hammer, Shooting Star, Bullish Engulfing, Bearish Engulfing, Morning Star, and Evening Star. Learning fewer patterns thoroughly produces better results than superficially knowing dozens of formations. Once you can consistently identify these fundamental patterns and understand their market psychology, gradually add continuation patterns and more complex formations to your trading toolkit over several months of practice and observation.
Read More: How to find the best broker?
Do candlestick patterns work on all timeframes?
Candlestick patterns appear on all timeframes from one-minute to monthly charts, but their reliability varies significantly based on the time horizon selected. Daily, four-hour, and weekly charts generally provide the most dependable signals with less market noise, while patterns on one-minute or five-minute charts produce more false signals requiring tighter risk management. The underlying principles remain consistent across timeframes, but longer-duration charts filter out random price fluctuations and reflect more meaningful market sentiment shifts that lead to higher probability trades.
What is the difference between a Doji and a Hammer candlestick?
A Doji forms when the opening and closing prices are virtually identical, creating a cross or plus sign shape with wicks extending above and below, signaling market indecision without clear directional bias. A Hammer features a small body near the top of the candle with little or no upper wick and a long lower wick at least twice the body’s length, indicating sellers pushed prices lower but buyers regained control by the close. While Dojis suggest indecision requiring additional confirmation, Hammers specifically signal potential bullish reversals when appearing at downtrend bottoms near support levels.
Should I use candlestick patterns alone or with other indicators?
Never rely on candlestick patterns alone—always combine them with additional technical analysis tools for confirmation and context. Integrate support and resistance levels, trend analysis, volume indicators, and momentum oscillators like RSI or MACD to validate pattern signals and filter false setups. Research consistently shows that candlestick patterns work best when combined with other technical indicators rather than used as standalone trading signals, with combined approaches producing significantly higher success rates than pattern-only strategies across all market conditions.
How long does it take to learn candlestick pattern recognition?
Developing reliable candlestick pattern recognition typically requires three to six months of consistent daily practice, though individual learning speeds vary based on prior trading experience and study dedication. Spend at least 30-60 minutes daily analyzing historical charts across multiple currency pairs and timeframes, identifying patterns and noting their outcomes. Most traders achieve basic pattern identification within four to eight weeks, especially when actively studying Forex Candlestick Patterns across different market conditions and trading environments.
However, traders usually require additional months to master context evaluation, confirmation techniques, and the psychological discipline needed to execute pattern-based trades confidently without second-guessing valid setups. Consistent practice with Forex Candlestick Patterns helps traders build stronger analytical skills, improve decision-making, and develop more reliable long-term trading strategies.
Become a Professional Trader with BrokerSift
You can take advantage of the powerful features and educational resources available on BrokerSift to improve your trading knowledge and become a more professional trader. From in-depth forex and crypto trading guides to technical analysis tutorials, broker reviews, and market insights, BrokerSift provides the tools traders need to make smarter and more confident trading decisions. Whether you are a beginner learning the basics or an experienced trader looking to refine your strategy, BrokerSift can help you grow your skills and move closer to becoming a successful professional trader.
What is the success rate of candlestick patterns in forex markets?
Success rates for candlestick patterns vary widely depending on pattern type, market context, timeframe, and confirmation methods used, typically ranging from 50-70% for well-confirmed setups at key technical levels. Single-candle patterns like Dojis show lower reliability (40-55%) without additional confirmation, while multi-candle reversal patterns such as engulfing formations demonstrate higher success rates (60-75%) when appearing at established support or resistance with volume confirmation. These percentages improve substantially when traders combine patterns with proper risk management, trend analysis, and supporting technical indicators rather than trading patterns mechanically without context consideration.
Which candlestick pattern is the most reliable for beginners in Forex trading?
Bullish Engulfing and Hammer patterns are considered two of the most beginner-friendly and reliable candlestick patterns. They are easy to spot and often signal strong potential trend reversals when combined with support levels and volume confirmation.
How do traders use candlestick patterns to predict market reversals?
Traders analyze candle shapes, wick sizes, and candle combinations to understand market psychology. Patterns like Morning Star, Doji, and Shooting Star can indicate weakening momentum and possible reversal zones before price changes direction.
What’s the difference between bullish and bearish candlestick patterns?
Bullish patterns suggest potential upward price movement and buying pressure, while bearish patterns indicate possible downward movement and selling pressure. For example, a Bullish Engulfing pattern signals strength from buyers, whereas a Bearish Engulfing pattern warns of increasing seller control.
Can candlestick patterns really improve Forex trading accuracy?
Yes, candlestick patterns can improve trading accuracy when used alongside technical analysis tools like support and resistance, trend lines, and indicators. They help traders identify better entry and exit points instead of relying on random market movements.
Which Forex candlestick patterns work best in volatile market conditions?
Patterns like Doji, Engulfing Candles, and Morning/Evening Stars are especially useful during volatile market conditions because they reveal sudden shifts in market sentiment and momentum, helping traders react faster to rapid price changes.
Share your view about “7 Powerful Forex Candlestick Patterns Every Beginner Must Know” in the comment section.
Your email stays private. Thoughtful takes and respectful disagreement are welcome.