

Forex support and resistance explained: Support represents a price level where buying pressure consistently overcomes selling pressure, preventing further decline, while resistance is where selling pressure overcomes buying, preventing further price increases. These fundamental technical analysis concepts help traders identify where currency pairs are likely to reverse or pause, forming the foundation for countless trading strategies across all timeframes and market conditions.
What Are Support and Resistance Levels in Forex?
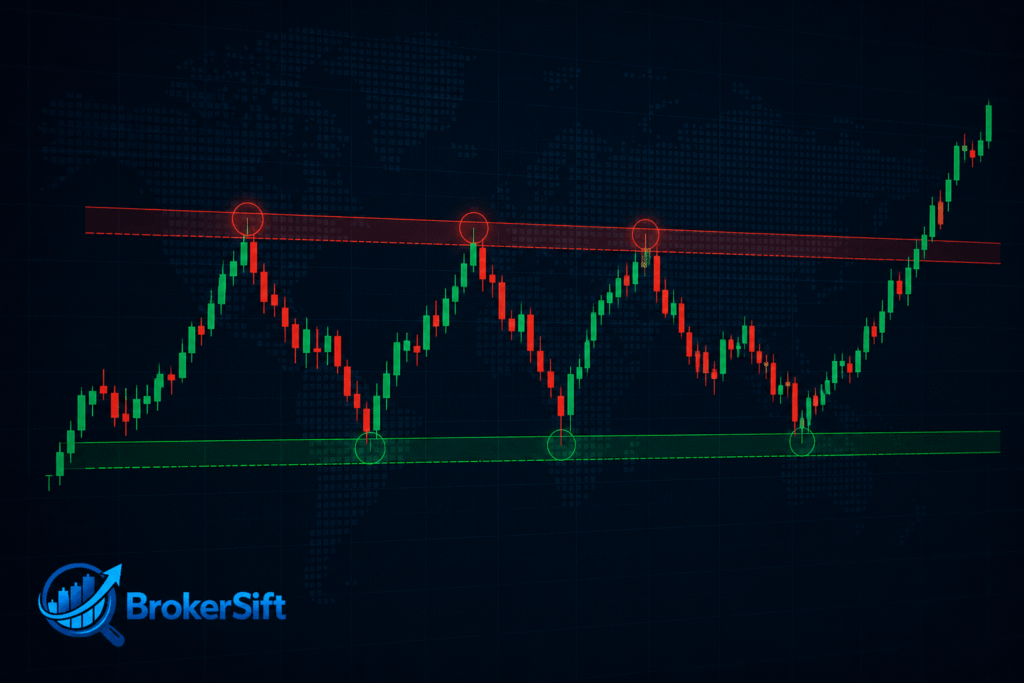
Support and resistance levels are specific price zones where the forces of supply and demand meet in particularly meaningful ways. A support level acts as a price floor—a point where buying interest is strong enough to prevent the price from falling further. When a currency pair approaches support, traders anticipate increased buying activity, which creates upward pressure on the price. Conversely, a resistance level functions as a price ceiling where selling pressure dominates and prevents prices from rising higher.
These levels matter tremendously because they represent psychological price points where traders collectively make decisions. When EUR/USD approaches 1.1000, for instance, traders who previously bought at that level may add to positions, while those who sold there might close shorts, creating clustered buying activity. This self-fulfilling prophecy effect strengthens as more market participants observe and trade around the same levels.
Think of support as a trampoline—when a ball drops onto it, the elastic surface pushes it back up. The stronger the trampoline (more buying interest), the higher the bounce. Resistance works like a ceiling in a room: when you throw a ball upward, it hits the ceiling and falls back down. These simple analogies capture the essence of how support and resistance basics function in real currency markets.
Support and resistance levels are among the most widely used technical analysis tools, with over 90% of technical traders incorporating them into their strategies. This widespread adoption creates a feedback loop: the more traders who watch specific levels, the more significant those levels become when price approaches them.
How to Choose the Best Forex Brokers? Compare top forex brokers, review their fees, trading conditions, and platform features, and choose the option that best fits your trading goals and experience level.

How Support and Resistance Work in Currency Trading
The psychology behind support and resistance levels reveals why prices repeatedly bounce at certain points. When a currency pair like GBP/USD declines to 1.2500 and reverses multiple times, that level becomes etched in traders’ memories. Those who missed buying opportunities at 1.2500 previously now place pending buy orders there, anticipating another bounce. Meanwhile, traders who sold higher might place profit-taking orders at that support level, adding to buying pressure.
Institutional order flow plays a critical role in creating these zones. Large banks, hedge funds, and institutional traders place substantial orders at specific price levels based on fundamental valuations, technical analysis, or algorithmic triggers. According to Bank for International Settlements research on forex market structure, institutional players account for the majority of daily forex volume, meaning their order placement significantly influences where support and resistance form.
The step-by-step mechanism works as follows: First, price approaches a known support or resistance level. Second, traders who monitor that level prepare to act—some place orders in advance, others wait for confirmation. Third, as price reaches the level, clustered orders execute simultaneously, creating sudden buying or selling pressure. Fourth, this pressure either reverses the price (confirming the level) or overwhelms it (creating a breakout). The critical factor is order density at these price points.
Consider a real EUR/USD example: Throughout 2023, the pair repeatedly found support at the 1.0500 level. In January, March, and May, whenever EUR/USD declined to 1.0500, buying pressure emerged, pushing the price back above 1.0600 within days. Each successful test reinforced trader confidence in that support level, making subsequent bounces more predictable. This pattern continued until a breakout occurred in October, demonstrating that even strong levels eventually break when market fundamentals shift.
When support breaks—meaning price closes convincingly below the level rather than just briefly touching it—a fascinating transformation occurs: that former support often becomes new resistance. This role reversal happens because traders who bought at what they thought was support now hold losing positions. When price rallies back to that level, these trapped traders exit at breakeven, creating selling pressure that turns the old support into resistance. This phenomenon occurs in approximately 70% of breakout scenarios, making it one of the most reliable technical patterns in forex trading.
How to Choose the Best Forex Brokers? Compare top forex brokers, review their fees, trading conditions, and platform features, and choose the option that best matches your trading goals and experience level.
Types of Support and Resistance Levels
Understanding the various types of support and resistance levels allows traders to build more comprehensive analysis. Each type offers unique advantages depending on market conditions and trading timeframes.
Horizontal Support and Resistance
Horizontal levels are the most straightforward type, drawn as static price zones from previous swing highs and lows. When USD/JPY reaches 150.00—a level where it previously reversed multiple times—that horizontal line represents horizontal resistance. These levels persist regardless of time passage, maintaining relevance for weeks, months, or even years. Traders identify horizontal levels by examining historical price action and marking areas where significant reversals occurred.
Dynamic Support and Resistance
Unlike static horizontal levels, dynamic support and resistance change over time. Moving averages are the most common dynamic levels—the 50-day and 200-day moving averages frequently act as support in uptrends and resistance in downtrends. Trendlines also provide dynamic levels: in an uptrend, the trendline connecting higher lows acts as dynamic support. These levels adapt to price movement, offering flexibility that horizontal levels lack but requiring continuous adjustment.
Psychological Levels
Round numbers like 1.2000 in EUR/USD or 100.00 in USD/JPY often act as stronger support or resistance due to clustered institutional orders. Human psychology gravitates toward round numbers—traders place stop losses, take profits, and pending orders at these clean figures. The 1.1000 level in EUR/USD, for example, consistently generates significant price reactions because thousands of traders watch it simultaneously. These psychological levels require no calculation; simply identifying round numbers on any currency pair reveals potential support and resistance zones.
Fibonacci Retracement Levels
Fibonacci retracement levels—particularly the 38.2%, 50%, and 61.8% retracements—act as support and resistance zones during pullbacks in trending markets. When GBP/USD rallies from 1.2000 to 1.3000, a retracement to the 61.8% Fibonacci level at approximately 1.2382 often finds support before the uptrend resumes. These levels work because many traders use Fibonacci tools, creating self-fulfilling prophecies similar to horizontal support and resistance.
Pivot Points
Pivot points, calculated from the previous period’s high, low, and close, provide predetermined support and resistance levels for the current trading session. Day traders particularly favor pivot points because they offer objective levels without subjective interpretation. The central pivot point, along with support levels S1, S2, S3 and resistance levels R1, R2, R3, give traders a framework for potential reversal zones throughout the trading day.
| Support/Resistance Type | Calculation Method | Best Market Conditions | Typical Timeframe |
|---|---|---|---|
| Horizontal | Previous swing highs/lows | Ranging markets | All timeframes |
| Dynamic (Moving Averages) | Average price over N periods | Trending markets | Daily, 4-hour |
| Psychological Levels | Round numbers (1.0000, 1.1000, etc.) | All conditions | All timeframes |
| Fibonacci Retracements | 38.2%, 50%, 61.8% of prior move | Trending markets with pullbacks | 4-hour, Daily |
| Pivot Points | (High + Low + Close) / 3 | Intraday range-bound | 1-hour, 15-minute |
How to Identify Support and Resistance on Forex Charts
Learning how to identify support and resistance systematically transforms abstract concepts into actionable trading tools. Follow these steps to mark reliable levels on any currency pair:
Step 1: Switch to higher timeframes. Begin your analysis on daily or 4-hour charts rather than 5-minute or 15-minute timeframes. Higher timeframe support and resistance levels are statistically more reliable than those on lower timeframes due to greater market participation. A support level on the daily chart represents decisions by more traders over longer periods, giving it substantially more significance than a 5-minute level that might reflect only temporary order imbalances.
Step 2: Mark previous swing highs and lows. Identify points where price made significant reversals—peaks where uptrends turned into downtrends (swing highs) and troughs where downtrends became uptrends (swing lows). These turning points reveal where supply overwhelmed demand or vice versa. On a EUR/USD daily chart, if price reversed from 1.1200 three times over six months, draw a horizontal resistance line at that level.
Step 3: Look for areas where price touched multiple times. A support level that has been tested 3-4 times without breaking is generally considered stronger than a level tested only once. The more touches, the more traders are aware of that level, and the more significant it becomes. However, also recognize that each test slightly weakens a level—eventually, repeated tests lead to breakouts as sellers or buyers exhaust their positions.
Step 4: Identify round numbers and psychological levels. Add horizontal lines at major round numbers relevant to the currency pair you’re analyzing. For EUR/USD, this means 1.0000, 1.0500, 1.1000, 1.1500, etc. For USD/JPY, mark 100.00, 105.00, 110.00, and similar levels. These require no historical price action to justify—their psychological significance alone makes them relevant.
Practical tip: Think zones, not lines. Price rarely respects exact pip levels. Instead of treating 1.1000 as a precise line, consider 1.0980-1.1020 as a support zone. This zone approach accounts for market noise, spread variations, and the reality that different traders mark levels slightly differently. When price enters your zone, watch for confirmation signals rather than assuming an automatic reversal.
Common mistake to avoid: Marking too many levels clutters charts and creates analysis paralysis. Limit yourself to 3-5 key support and resistance levels per currency pair. Focus on the most obvious, most tested, and most recent levels rather than every minor swing high or low from the past year. Clean charts lead to clearer decisions.
Trading Strategies Using Support and Resistance
Once you identify reliable support and resistance levels, several proven trading strategies using support and resistance forex markets offer become available. Each strategy suits different market conditions and risk tolerances.
Bounce Trading Strategy
Bounce trading involves buying at support levels and selling at resistance levels in ranging markets. When USD/CHF ranges between support at 0.8500 and resistance at 0.8700, traders buy near 0.8500 with a target near 0.8700, then reverse the trade. This strategy requires patience and confirmation—rather than blindly buying when price touches support, wait for a bullish candlestick pattern like a pin bar or bullish engulfing pattern that confirms buyers are indeed stepping in.
The key to successful bounce trading is proper risk management. Place stop losses just beyond the support or resistance level—if buying at support at 0.8500, place your stop at 0.8480, giving the trade 20 pips of breathing room while limiting losses if support breaks. Target the opposite boundary of the range, adjusting for realistic profit potential based on recent price movement within the range.
Breakout Trading Strategy
Breakout trading capitalizes on moments when price breaks through established support or resistance levels, signaling potential trend changes or continuations. When GBP/USD consolidates below resistance at 1.2700 for weeks, then suddenly breaks above with strong volume, breakout traders enter long positions anticipating continued upward movement. The challenge lies in distinguishing genuine breakouts from false breakouts (when price briefly penetrates a level before reversing).
To improve breakout reliability, wait for a candlestick close beyond the level rather than entering on the initial touch. If trading the 4-hour chart, wait for a 4-hour candle to close above resistance before entering. Additionally, look for increased volume or volatility accompanying the breakout—strong breakouts typically feature expansion in trading activity. Place stops below the broken resistance (which should now act as support), and target the next major resistance level or use a measured move technique.
Combining with Candlestick Patterns
Support and resistance levels gain tremendous power when combined with Japanese candlestick patterns. A pin bar (long wick, small body) forming at a support level provides much stronger confirmation than support alone. Similarly, a bearish engulfing pattern at resistance—where a large red candle completely engulfs the previous green candle—signals strong selling pressure at that level.
This combination approach dramatically improves win rates. Rather than assuming every touch of support produces a bounce, wait for price action confirmation through candlestick patterns. This patience filters out weaker setups and focuses trading capital on high-probability opportunities where both level significance and price action alignment.
Real GBP/USD Trade Example
Consider this practical scenario from October 2023: GBP/USD found support at 1.2100 on the daily chart, testing this level three times over two months without breaking lower. On the fourth approach to 1.2100, a bullish pin bar formed—a long lower wick showing rejection of lower prices, with the candle closing near its high.
Entry: Enter long at 1.2115 (just above the pin bar high) to confirm buyers have control.
Stop Loss: Place at 1.2060, approximately 55 pips below entry and beneath the pin bar low, accounting for the support zone rather than a single exact price.
Target: Set initial target at 1.2300, the next resistance level identified from previous swing highs, offering approximately 185 pips of profit potential—a risk-reward ratio exceeding 3:1.
This trade setup demonstrates how support identification, candlestick confirmation, and strategic stop/target placement work together to create a complete trading plan with defined risk and reward parameters.
Common Mistakes and Best Practices
Even experienced traders fall into predictable pitfalls when trading support and resistance. Recognizing these mistakes helps you avoid costly errors and develop more disciplined trading approaches.
Pitfall: Treating Support and Resistance as Exact Prices
New traders often draw precise lines at 1.1000 and expect price to reverse at exactly that pip level. Reality proves messier—price might reverse at 1.0995 or 1.1008. Markets don’t respect exact prices because different traders use different data feeds, timeframes, and drawing techniques. Always use zones rather than lines, typically spanning 15-30 pips depending on the currency pair’s average volatility and the timeframe you’re analyzing.
Pitfall: Using Levels from Very Low Timeframes
A support level on a 5-minute chart lacks the significance of one on the daily chart. Lower timeframes reflect short-term noise and temporary order imbalances rather than substantial shifts in supply and demand. While intraday traders might reference 15-minute or 1-hour charts, even they should confirm levels against 4-hour and daily timeframes. Avoid cluttering your analysis with support and resistance from timeframes below 1-hour unless you’re specifically scalping with very short holding periods.
Pitfall: Ignoring False Breakouts
False breakouts—when price briefly breaks a level then quickly reverses—trap countless traders who enter too early. A single 15-minute candle piercing resistance doesn’t confirm a breakout; wait for a 4-hour or daily candle close beyond the level. Even better, wait for a retest: after price breaks resistance, watch for it to pull back and test that level (now support) before continuing higher. This patience prevents many failed trades.
Best Practice: Wait for Confirmation Signals
Never trade support or resistance levels alone. Combine them with candlestick patterns, momentum indicators, or volume analysis for confirmation. If RSI shows oversold conditions as price approaches support, that confluence strengthens the setup. If a bullish engulfing pattern forms at support, you have visual confirmation of buyer commitment. Confirmation trading reduces impulsive entries and improves overall profitability.
Best Practice: Consider Level Strength
Not all support and resistance levels carry equal weight. Evaluate strength based on: (1) number of times tested—more tests generally mean stronger levels up to a point, (2) recency—levels tested within the past month are more relevant than those from two years ago, (3) timeframe—daily levels trump 1-hour levels, and (4) volume at the level—high volume rejections indicate stronger participation. Prioritize trading the strongest levels while treating weaker ones skeptically.
Best Practice: Combine with Other Technical Indicators
Support and resistance work best within a broader technical framework. Use moving averages to identify trend direction—in uptrends, focus on buying support; in downtrends, prioritize selling resistance. Employ momentum oscillators like RSI or MACD to identify divergences at key levels that signal potential reversals. Incorporate volume analysis to confirm whether breakouts have sufficient participation to sustain. This multi-indicator approach creates layered confirmation that substantially improves win rates.
Risk Consideration: Market Condition Matters
Support and resistance work better in trending or ranging markets, but prove less effective in choppy conditions. During high-impact news releases like Federal Reserve interest rate decisions or Non-Farm Payroll reports, price can slice through major support and resistance levels as if they don’t exist. Recognize when markets are in consolidation phases with conflicting signals, and reduce position sizes or avoid trading until clearer conditions emerge. The best support and resistance traders know when not to trade is as important as knowing when to enter positions.
Frequently Asked Questions
What is the difference between support and resistance in forex?
Support is a price level where buying pressure exceeds selling pressure, preventing further price declines and often causing upward reversals. Resistance is where selling pressure overcomes buying interest, stopping upward movement and frequently causing downward reversals. Support acts as a floor beneath price, while resistance functions as a ceiling above it, with both representing zones where supply and demand reach temporary equilibrium.
How do you identify strong support and resistance levels?
Strong support and resistance levels show multiple tests (typically 3-4 touches) without breaking, appear on higher timeframes like daily or weekly charts, coincide with psychological round numbers, and demonstrate clear price reactions with decisive reversals. Additionally, strong levels often align with other technical factors like Fibonacci retracements, moving averages, or previous significant swing points, creating confluence zones where multiple technical factors support the same price level.
Can support become resistance and vice versa?
Yes, role reversal occurs in approximately 70% of breakout scenarios where broken support becomes new resistance, and broken resistance becomes new support. This happens because traders who bought at what they believed was support now hold losing positions when it breaks, and they sell when price rallies back to that level to exit at breakeven, creating the selling pressure that transforms old support into new resistance. The same psychology works in reverse when resistance breaks and becomes support.
What timeframe is best for support and resistance trading?
Daily and 4-hour charts provide the most reliable support and resistance levels because they incorporate more market participation and filter out short-term noise. While day traders may use 1-hour charts for timing entries, they should always confirm levels against higher timeframes. Weekly charts offer extremely strong levels for long-term position traders, while anything below 1-hour becomes increasingly unreliable due to temporary order flow imbalances that don’t reflect genuine supply-demand shifts.
Do support and resistance levels work in all market conditions?
No, support and resistance work best in clearly trending or ranging markets but become less reliable during choppy, low-liquidity conditions or high-impact news events. During major economic announcements, price can ignore even strong support and resistance levels as fundamental news overwhelms technical considerations. Similarly, in sideways, directionless markets with conflicting signals, levels may produce false breakouts and unpredictable price action, making other trading approaches more suitable.
How many times should a level be tested to be considered strong?
A support or resistance level tested 3-4 times without breaking is generally considered strong and reliable for trading decisions. However, recognize that each test slightly weakens the level as buyers or sellers exhaust their positions at that price. After five or six tests, the probability of a breakout increases significantly, so extremely tested levels require extra caution and tighter stop losses despite their apparent strength from multiple successful defenses.
Should I use exact price levels or zones for support and resistance?
Always use zones rather than exact price levels, typically spanning 15-30 pips depending on the currency pair’s volatility and your trading timeframe. Price rarely reverses at a precise pip level due to differences in broker feeds, spread variations, and market microstructure. Zones account for these realities and prevent missed opportunities when price reverses at 1.0995 instead of your exact 1.1000 line, while also providing more realistic areas for stop loss and target placement.
Original educational content developed for forex traders seeking to understand fundamental technical analysis concepts. All strategies, examples, and data points provided for educational purposes only and do not constitute trading advice. Past performance of currency pairs mentioned does not guarantee future results.
What is support and resistance in forex?
Support and resistance are key price levels where the market tends to reverse or pause.
Support = a price level where buying pressure stops price from falling further.
Resistance = a level where selling pressure stops price from rising further.
Traders use these levels to find entry and exit points.
What is the 3 5 7 rule in forex?
The 3-5-7 rule is a risk and discipline guideline:
3% risk per trade (never risk too much on one trade)
5 trades per day maximum (avoid overtrading)
7% weekly drawdown limit (protect capital from large losses)
It helps traders stay consistent and control emotions.
What is the 3 6 9 rule in trading?
The 3-6-9 rule is a timing and psychology concept:
3 minutes / short focus decisions (avoid hesitation)
6 trades or setups review (analyze before acting)
9 out of 10 rule = only take high-probability setups
It is used to improve discipline and patience in trading.
What is the 90-90-90 rule for traders?
The 90-90-90 rule states:
90% of traders lose 90% of their money in the first 90 days.
It highlights that most beginners lose due to lack of risk management, strategy, and emotional control.
Share your view about “Forex Support and Resistance Explained (Beginner’s Guide)” in the comment section.
Your email stays private. Thoughtful takes and respectful disagreement are welcome.